Concerned about price drops? Collars slow down the fall
Since the "free" put from central banks is no longer provided in the context of rising interest rates, investors are taking the hedging of their portfolios back into their own hands with the use of the collar strategy.
Anita Colic, Multi-Asset Solutions

The collar is a hedging strategy that protects investors from a sharp decline in prices. A collar combines buying put options (hedging against falling share prices) with selling call options to reduce the cost of the puts. Whether or not a collar strategy is worthwhile is determined, on the one hand, by the cost/return ratio when taking out the two options and, on the other, the performance of the equity markets. Depending on the current market situation, the costs of buying a put option can be more or less offset by the premium when selling the call option.
The «free» put option from central banks
In the low or negative interest rate environment of recent years, a conservative portfolio (75% bonds, 25% equities) generally had a better risk/return ratio than a balanced portfolio (60% bonds, 40% equities). The reason for this is that the central banks immediately took on the role of "saving the day" in times of crisis. They supported the markets with liquidity and interest rate cuts. Investors thus benefited from a "free" put. In this situation, a collar strategy usually made little sense.
Now the tide has turned. Central banks have seen themselves compelled to change their expansionary course and raise interest rates even when the stock markets are falling. The bond portion of the portfolio is exposed to a high risk due to the tightening of monetary policy.
A collar improves the risk/return ratio
Hedging with a collar enables the risk of loss to be reduced here. This makes it possible for cautious investors who would otherwise invest in a conservative portfolio to put their money into a portfolio with a higher equity allocation and thus a more attractive risk/return ratio.
Putting the collar strategy to the test
What does it look like in practice? For this purpose, we used indices of a balanced (LPP 401) and conservative (LPP 25) portfolio for our calculations and determined the difference between the rolling Sharpe ratios2 of the two indices. The following chart shows that, above the 0% threshold, a balanced portfolio is more attractive in relation to a conservative portfolio. The development of the 10-year US Treasury rate is also shown. Particularly at the beginning of the current year, there was a steep rise in interest rates, which correlated positively with a higher Sharpe ratio of the balanced portfolio. The significant Sharpe ratio advantage of more than 50% thus underpins the thesis that the balanced LPP 40 portfolio is the better choice from a risk/return perspective in the environment of rising interest rates.
Sharpe ratio advantage of the LPP 40 portfolio

Attractive timing for a collar strategy
As explained at the beginning, a collar strategy is attractive if the difference between the premium to be paid from the purchase of a put option and the premium received from the sale of the call option is small. In fact, following a collar strategy is particularly attractive in the current market environment in a historical comparison, as the following chart shows:
Difference between the call and put premium
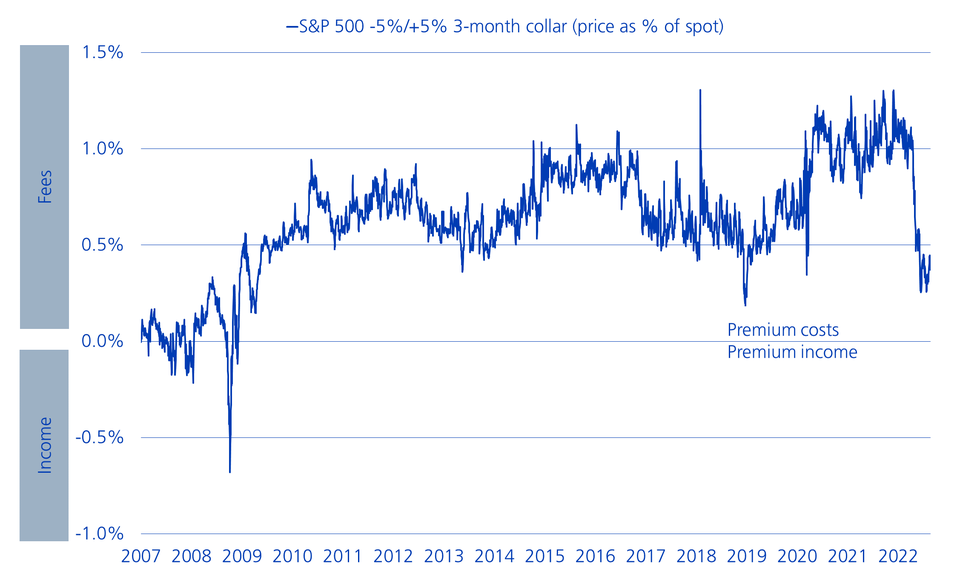
To measure the attractiveness, we consider the purchase of a put with a strike price at 95% and the sale of a call with a strike price at 105% on the S&P 500 index. The duration of each option is three months. We compared the costs of the collar strategy with the hedging volume. At a threshold of over 0%, the put option is more expensive than the call option, which only partially offsets the hedging costs for the put options purchased, and vice versa. The 0% threshold therefore represents the break-even point.
Conclusion
The coronavirus pandemic, the war in Ukraine and the unresolved geopolitical issues are fuelling uncertainty on the market. Under these premises, it is worth considering forward-looking and cost-effective protection against possible losses. In our protection solutions, we make this available to our customers in an efficient manner.
1 The Pictet LPP 40 portfolio contains 40% equities and 60% bonds. The Pictet LPP 25 portfolio contains 25% equities and 75% bonds.
2 The Sharpe ratio is a risk-adjusted performance metric that measures the excess return compared to the risk-free interest rate in relation to the risk taken.